Cholesterol Synthesis Pathway Diagram
Explore a cholesterol synthesis pathway diagram from acetyl-CoA and HMG-CoA through mevalonate, isoprenoids, squalene, lanosterol, and cholesterol.
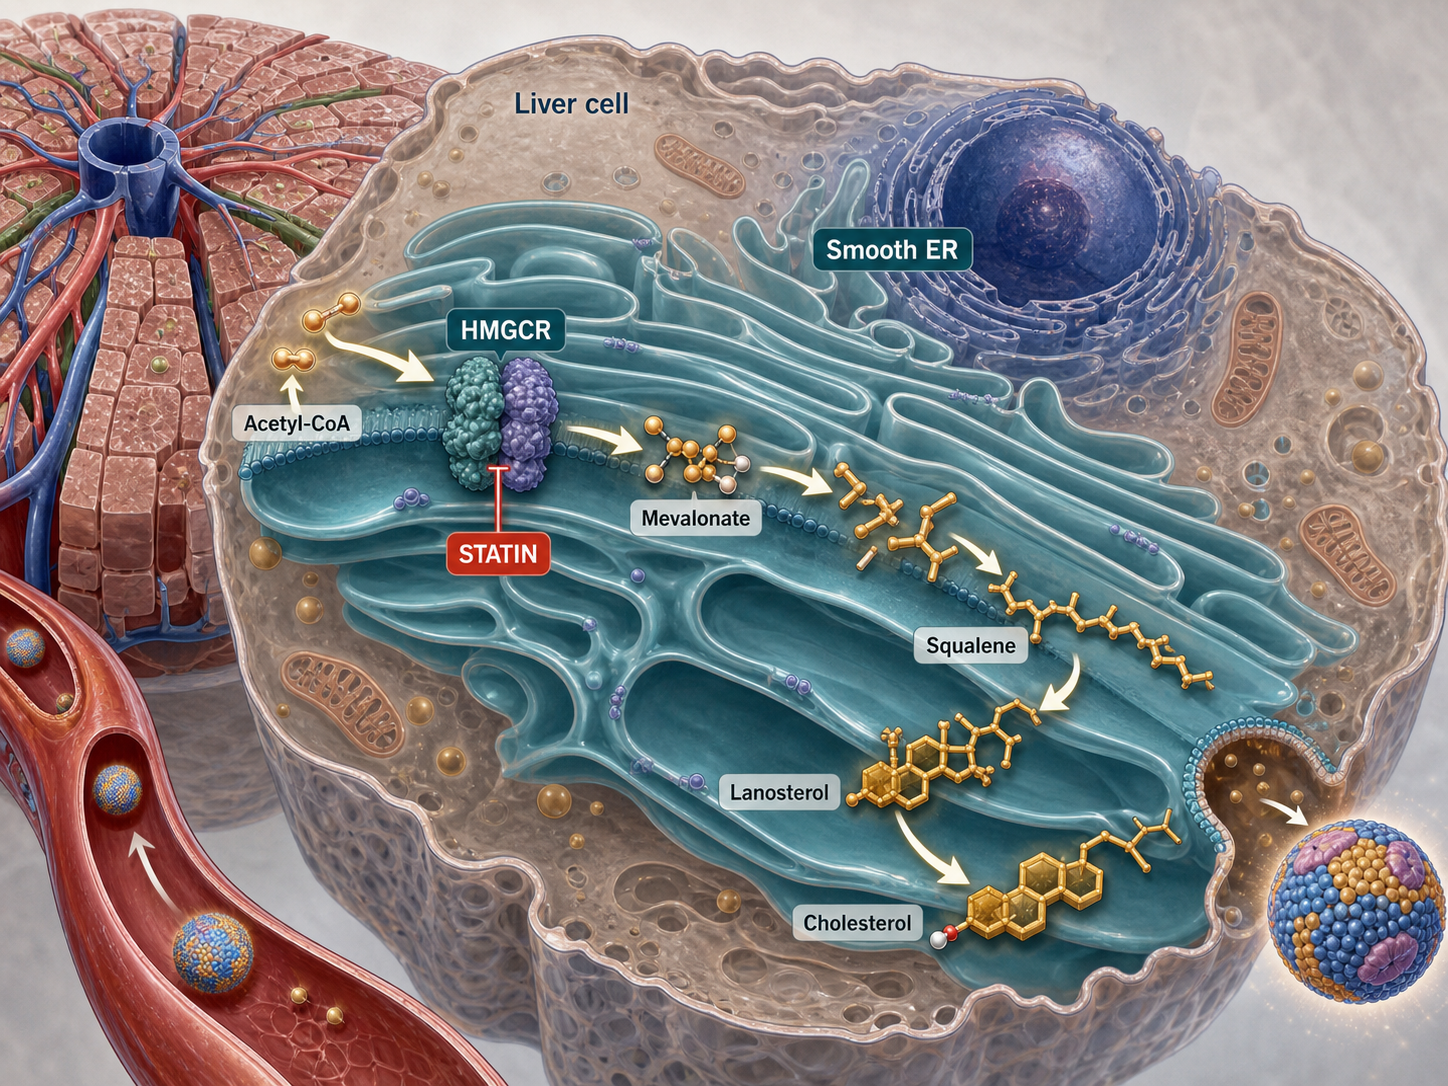
What this mechanism diagram shows
Cholesterol biosynthesis converts cytosolic acetyl-CoA into mevalonate and activated isoprenoid units, then builds squalene, lanosterol, and cholesterol. HMG-CoA reductase is a major regulated and drug-targeted step, while later reactions span the cytosol and endoplasmic reticulum.
- 1Acetyl-CoA condenses to form HMG-CoA.
- 2HMG-CoA reductase converts HMG-CoA to mevalonate.
- 3Mevalonate is converted into activated isoprenoid units.
- 4Isoprenoid units form squalene, which cyclizes to lanosterol.
- 5Lanosterol undergoes multiple reactions to yield cholesterol.
Main stages of cholesterol biosynthesis
Group the pathway into acetyl-CoA condensation, mevalonate formation, activated isoprenoid production, squalene synthesis, sterol-ring formation, and conversion of lanosterol to cholesterol. This staged layout is easier to read than displaying every enzyme at equal prominence.
Show HMG-CoA reductase at the rate-regulated mevalonate step and place statin inhibition directly beside it. Add ATP and NADPH only when metabolic cost is important to the figure.
Regulation and cellular context
SREBP-dependent transcription, sterol feedback, enzyme degradation, and phosphorylation help regulate HMG-CoA reductase. A focused regulation panel can explain how cells respond to low or high sterol availability.
For lipid-metabolism figures, connect cholesterol to membrane synthesis, steroid hormones, bile acids, or lipoprotein handling only when those branches support the question.
Generate a custom mevalonate pathway diagram
Use the prompt below, choose the desired biochemical detail, and specify any enzyme deficiency or drug target. Verify intermediate names and compartment placement before publication.
Scientific sources and content method
Sources checkedThis mechanism text was prepared with an AI-assisted editorial workflow and checked against the peer-reviewed sources below. It is for research communication and education, not medical advice; verify it against your study context before publication.
Last source check:
- An Atomic-Level Perspective of HMG-CoA-Reductase: The Target Enzyme to Treat Hypercholesterolemia
Molecules (2020) · DOI: 10.3390/molecules25173891
Reusable prompt
Paste this into MechFig, then replace the ingredient, pathway, or target tissue with your own research context.
Metabolic pathway flowchart for cholesterol biosynthesis, enzyme at arrows, textbook style. Scientific content: Acetyl-CoA → HMG-CoA → HMGCR (rate-limiting) → mevalonate → … → cholesterol; statins inhibit HMGCR.
Embed this mechanism diagram
Copy the HTML below to include descriptive image text and attribution back to this example page. Confirm that your use complies with applicable rights and site terms before publication or commercial use.
FAQ
What is the rate-limiting enzyme in cholesterol synthesis?
HMG-CoA reductase is the major rate-regulated enzyme of the mevalonate pathway and the direct target of statins.
Where does cholesterol synthesis occur?
The pathway involves cytosolic reactions and enzymes associated with the endoplasmic reticulum, especially in liver and other cholesterol-producing cells.
What should a cholesterol synthesis diagram include?
Include acetyl-CoA, HMG-CoA, HMG-CoA reductase, mevalonate, activated isoprenoids, squalene, lanosterol, cholesterol, and any relevant regulatory or drug target.