Climate model data pipeline Mechanism Diagram
Create a clear climate model data pipeline mechanism diagram for papers, PPT slides, research summaries, and environmental science education. Start from a reusable prompt and adapt it to your own pathway.
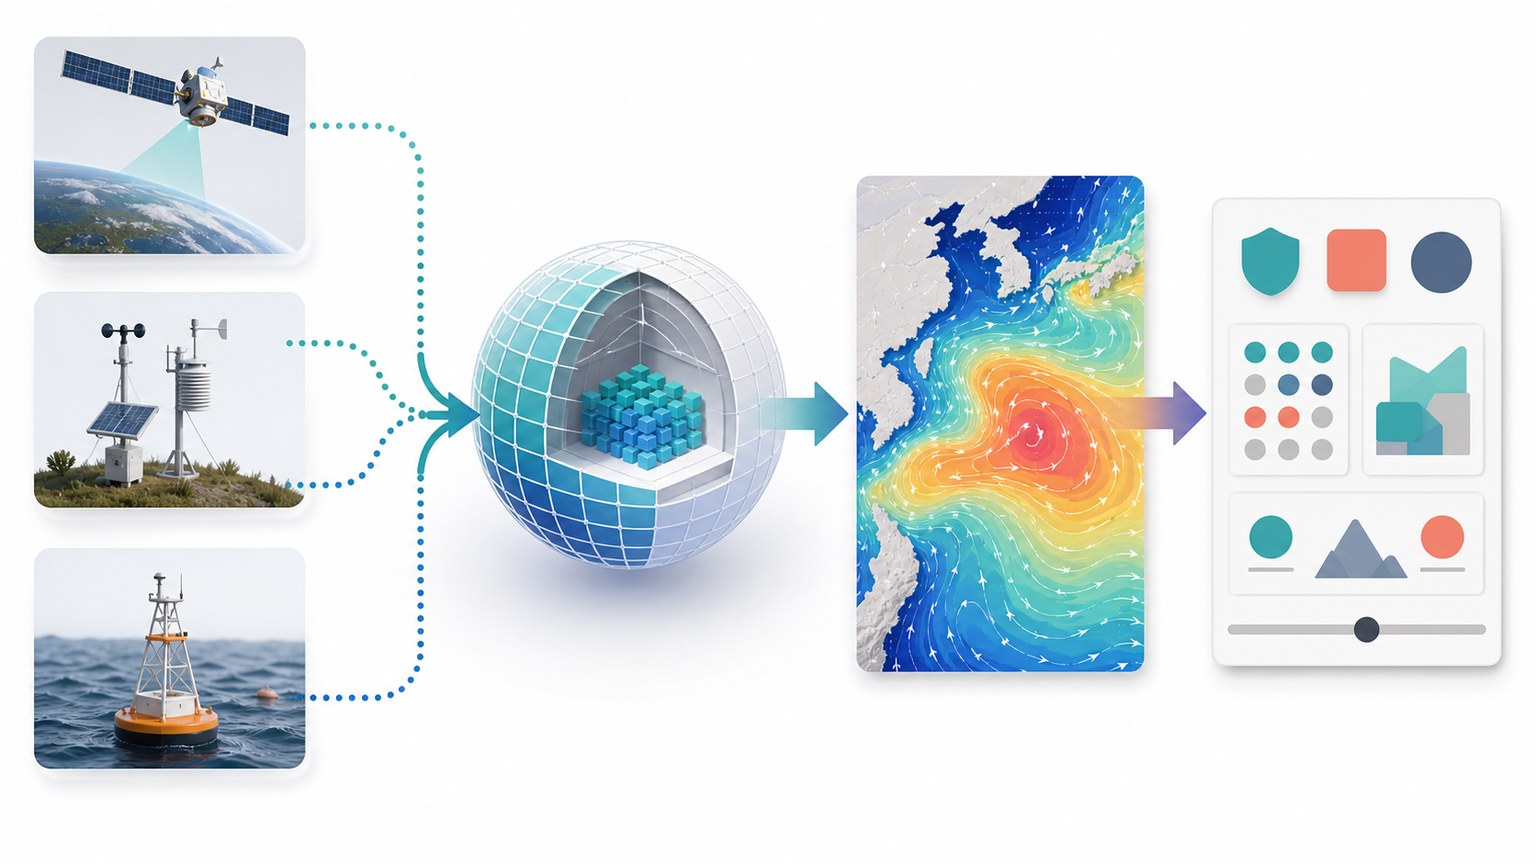
这张机制图展示了什么
This climate model data pipeline mechanism diagram turns the homepage example into a searchable, reusable scientific figure page. It is designed to help readers understand the mechanism structure before generating their own version in MechFig.
- 1Observations and emissions scenarios enter
- 2numerical models simulate
- 3ensembles and uncertainty are assessed
- 4regional scenario outputs are produced
可复用提示词
将提示词放入 MechFig,再把成分、通路或目标组织替换为你的研究内容。
Climate data pipeline with globe grid, datasets, model blocks, and uncertainty bands; clear scientific vector, no disaster imagery or people.. Scientific content: Observations and emissions scenarios enter → numerical models simulate → ensembles and uncertainty are assessed → regional scenario outputs are produced.
常见问题
What should a climate model data pipeline mechanism diagram include?
It should include the starting trigger or input, the major pathway nodes, directional arrows between steps, and a concise endpoint that explains the biological meaning.
Can I use this as a starting point for my own figure?
Yes. Use the prompt as a structure, then replace the pathway, ingredient, disease context, or endpoint with your own research content.